The latest consumer price data dominated what was an otherwise light week in terms of fresh economic data. Inflation data have taken on increased importance as we all try to predict when the Federal Open Market Committee (FOMC) will embark on its highly-anticipated easing cycle. This week's data tell us, it may be awhile.
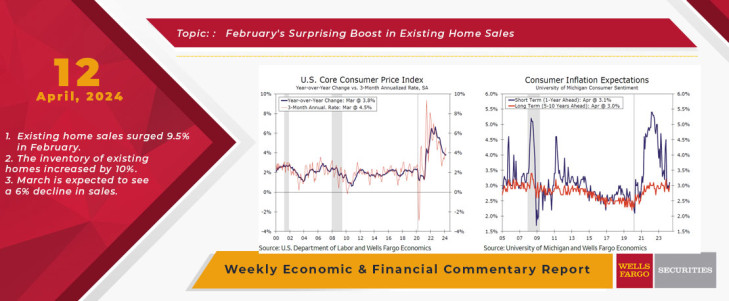
The Consumer Price Index (CPI) came in hot in March, rising 0.4% at both a headline and core level (once we strip out food and energy prices). As seen in the nearby chart, the three-month annualized rate of the core CPI climbed to 4.5%, an indication price growth accelerated in the first quarter. Core goods deflation returned in March, but core services inflation remains stubborn. The descent in shelter costs remains painstakingly slow as the real-time measures take time to show up in the CPI data. Primary shelter inflation rose 0.4% in March, while core services ex-housing was also hot, up 0.6%, amid gains in medical services as well as motor vehicle insurance and maintenance.
We suspect the first quarter acceleration in core CPI reflects the often-choppy nature of monthly price movements and is a “bump” in the road back toward the Fed's inflation target, rather than a sign that slowing inflation is reversing course. But bumps still slow the journey, and we're not yet there in terms of Fed easing.
While we expect inflation to trend lower as the year progresses, it is still a problem today. Inflation was reported as the single most important problem faced by small business owners in March. In addition to elevated cost pressure, dwindling sales expectations and challenges finding qualified labor pushed small business sentiment to its lowest level since 2012 last month. But input price pressure is showing signs of easing as the Producer Price Index (PPI) showed a bit more improvement than the CPI in March, rising just 0.2%, or the slowest in three months. The PPI data still suggest the core PCE deflator, the Fed's preferred measure of consumer price inflation, will also show stalled progress in reducing inflation (data released April 26). Ultimately consumers still face rising prices. Year-ahead consumer inflation expectations rose to 3.1%, while expectations 5-10 years out hit 3.0% in early April. Despite hitting the highest level in six months, as seen in the nearby chart, long-term expectations are still consistent with its recent range and will be considered "anchored" by the Fed.
Overall, the latest data push out the timing and degree of Fed easing this year. We now expect the FOMC to first cut the fed funds rate by 25 bps at its Sept. 18 policy meeting followed by 25 bps rate cuts at every other FOMC meeting through the end of next year. This means just 50 bps of total easing in 2024 followed by another 100 bps of easing in 2025, which puts the target range for the fed funds rate at 3.75%-4.00% at year-end 2025. For our full economic forecast, please see our latestMonthly Economic Outlook published this week.
This Week's State Of The Economy - What Is Ahead? - 11 March 2022
Wells Fargo Economics & Financial Report / Mar 16, 2022
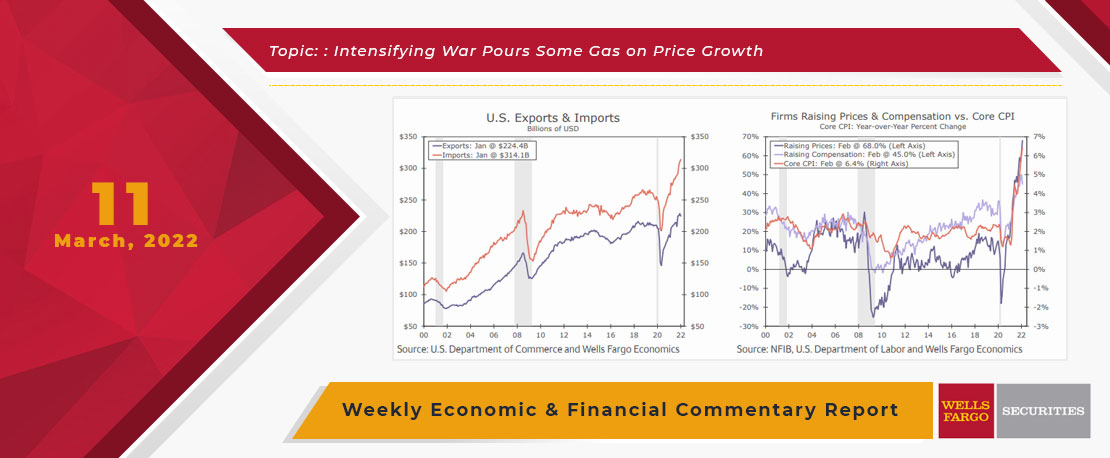
Russia\'s invasion of Ukraine continues to consume nearly all media attention and has created a level of volatility that is not yet reflected in the data released this week.
This Week's State Of The Economy - What Is Ahead? - 09 April 2021
Wells Fargo Economics & Financial Report / Apr 10, 2021
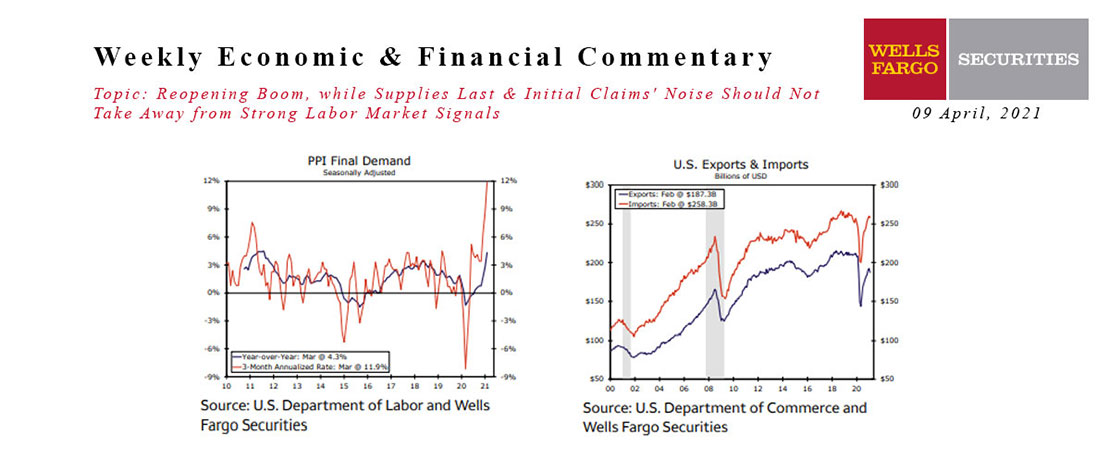
This week\'s economic data kicked of with a bang. The ISM Services Index jumped more than eight points to 63.7, signaling the fastest pace of expansion in the index\'s 24-year history.
This Week's State Of The Economy - What Is Ahead? - 15 April 2022
Wells Fargo Economics & Financial Report / Apr 18, 2022
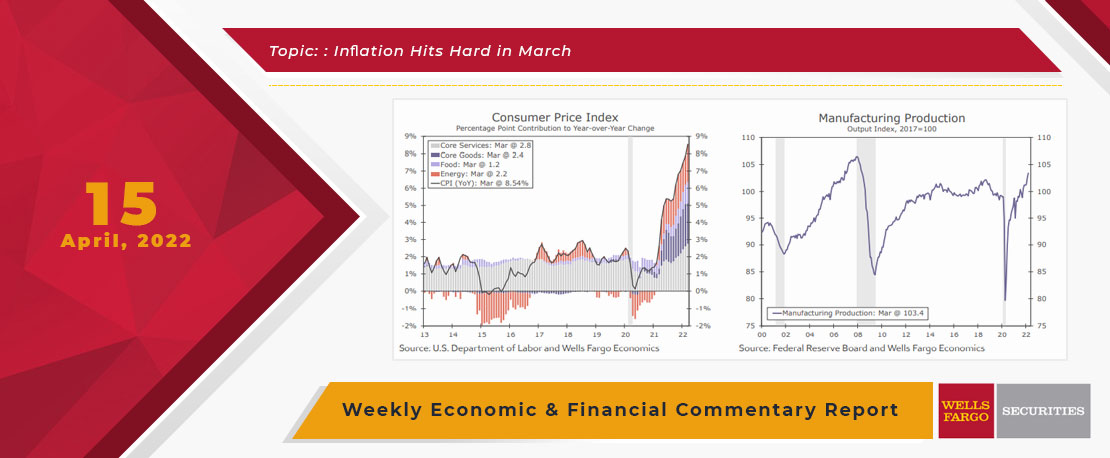
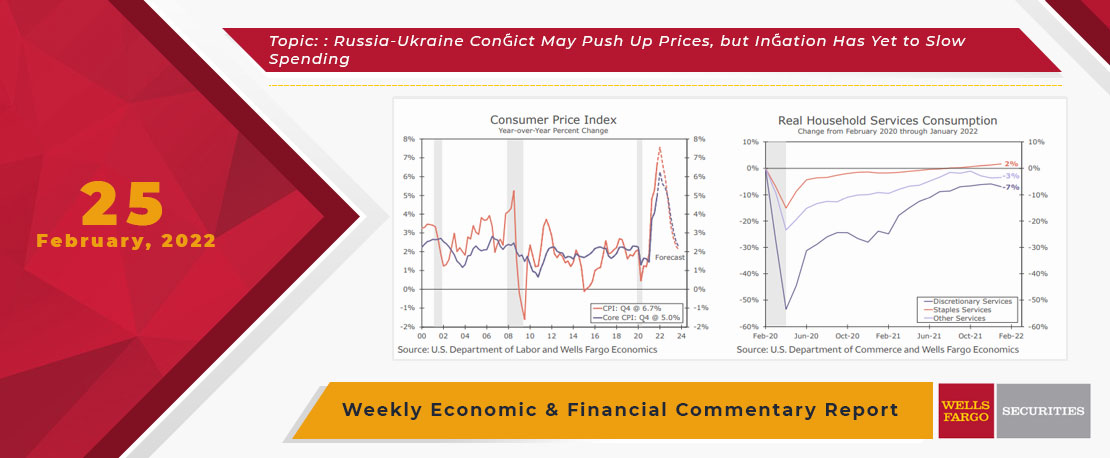
What do pollen and the Consumer Price Index (CPI) have in common? Answer; both are hitting new highs. This week’s U.S. economic data was led by the largest month monthly increase in the Consumer Price Index (CPI) since September 2005.
This Week's State Of The Economy - What Is Ahead? - 15 January 2021
Wells Fargo Economics & Financial Report / Jan 18, 2021
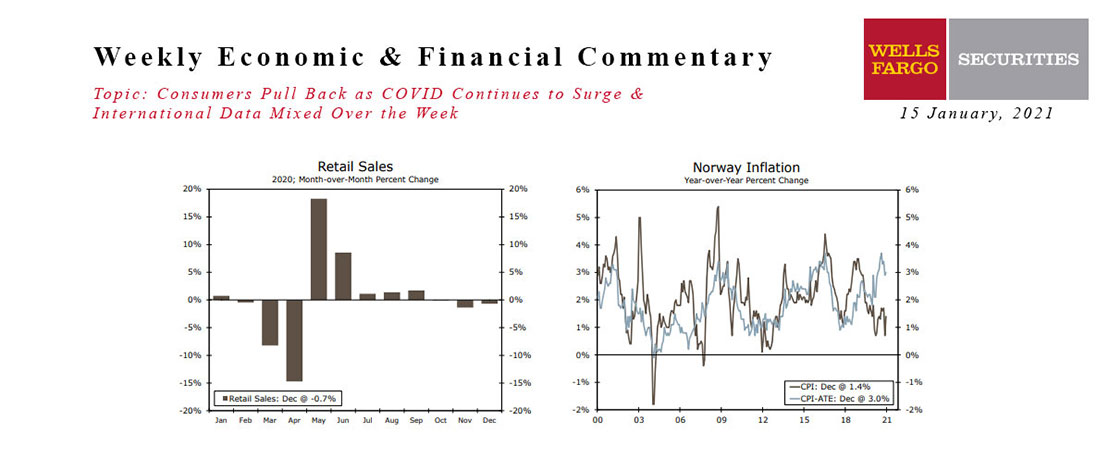
Retail sales fell 0.7% in December, the third straight monthly decline. Sales are still up 2.9% over the year, however.
This Week's State Of The Economy - What Is Ahead? - 25 February 2022
Wells Fargo Economics & Financial Report / Feb 27, 2022
What a crazy week. It’s hard to worry about something as relatively unimportant as economic trends when one thinks about what folks in Ukraine are enduring, but economies are nonetheless impacted.
This Week's State Of The Economy - What Is Ahead? - 21 October 2022
Wells Fargo Economics & Financial Report / Oct 25, 2022
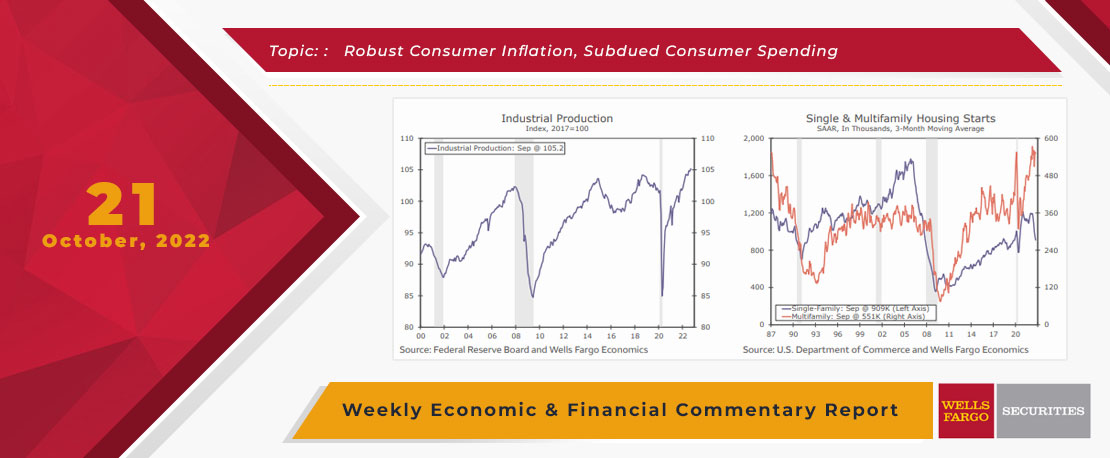
The real estate sector has been significantly affected by rising interest rates, with total housing starts falling 8.1% in September. Peering ahead, the forward-looking Leading Economic Index points to a recession in the coming year.
This Week's State Of The Economy - What Is Ahead? - 20 October 2023
Wells Fargo Economics & Financial Report / Oct 27, 2023
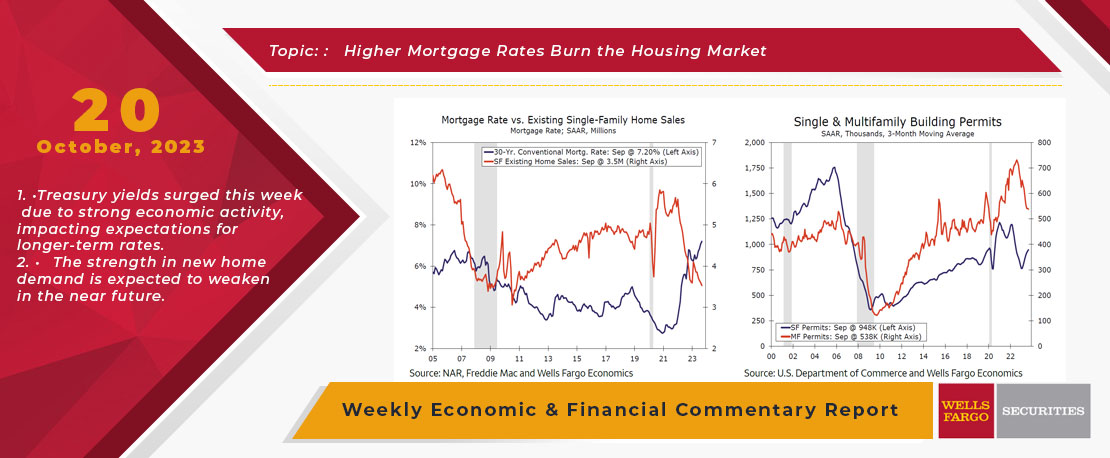
Treasury yields surged this week due to strong economic activity, impacting expectations for longer-term rates. New home sales led to a rise in single-family permits, but spiking mortgage rates are testing builder affordability strategies.
This Week's State Of The Economy - What Is Ahead? - 19August 2022
Wells Fargo Economics & Financial Report / Aug 23, 2022
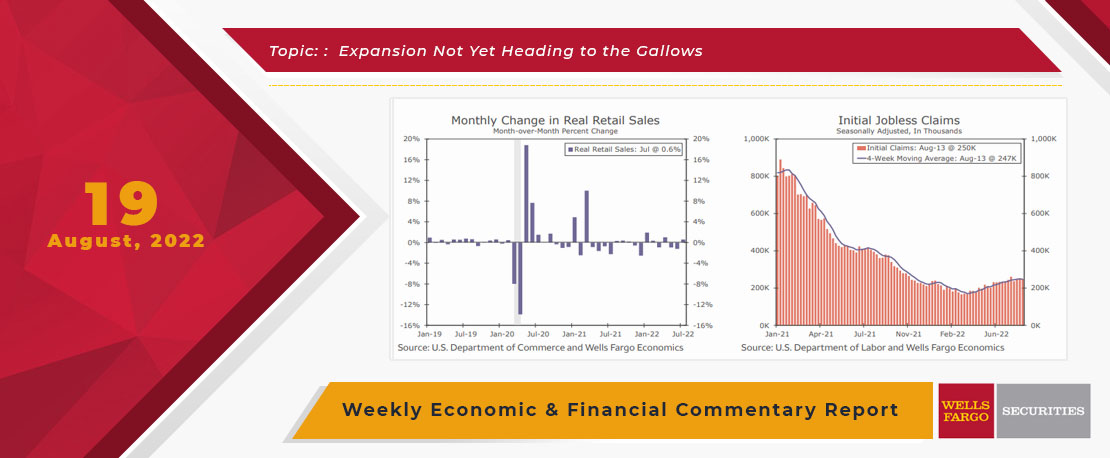
July data indicates that we celebrated a decline in gas prices by going shopping, boosting retail sales figures. I’m not sure I get the connection...
This Week's State Of The Economy - What Is Ahead? - 27 September 2019
Wells Fargo Economics & Financial Report / Sep 28, 2019
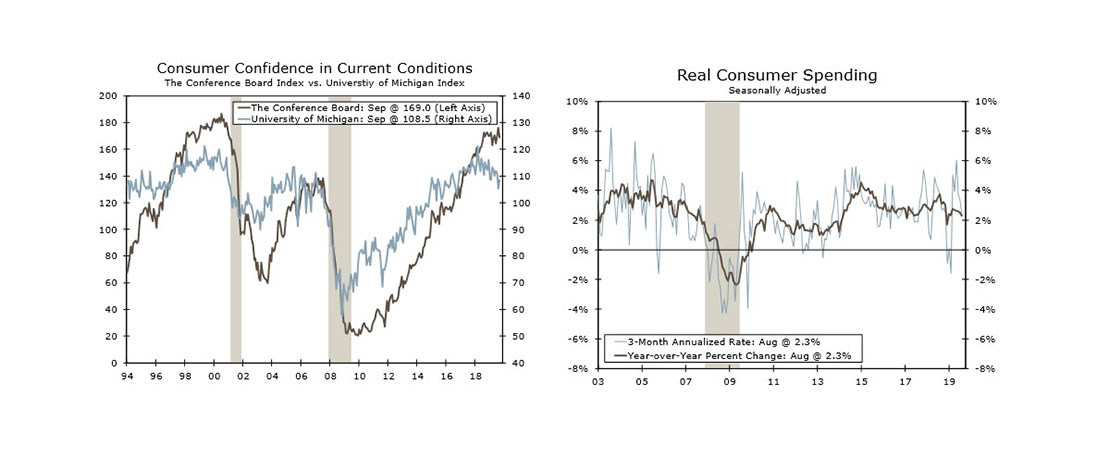
The release of the transcript of President Trump\'s phone conversation with Ukraine President Volodymyr Zelenskiy and the whistle blower complaint overshadowed most of this week\'s economic reports and took bond yields modestly lower.
This Week's State Of The Economy - What Is Ahead? - 03 February 2023
Wells Fargo Economics & Financial Report / Feb 04, 2023
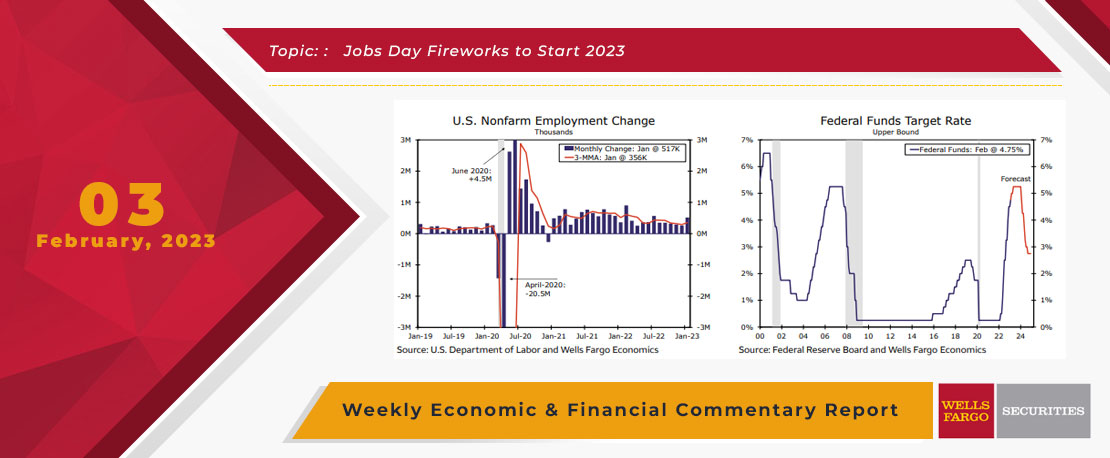
During January, payrolls jumped by 517K, the unemployment rate fell to 3.4% and average hourly earnings rose by 0.3%. The FOMC raised the fed funds target range by 25 bps to 4.5%-4.75% this week.


